
Financials
Supplemental Financial Information
Revenues
At the core of Harvard Business School’s economic model is internally funded faculty research. The resulting intellectual capital is disseminated through the School’s educational programs (including MBA, Doctoral, Executive Education, and HBX) as well as through Harvard Business Publishing to students, academics, and managers around the world.
Completing a self-sustaining cycle, revenues—from MBA tuition, alumni gifts, and Executive Education and HBP (and eventually HBX) margin contributions—serve as the primary source of research funding. These funds also provide crucial support for innovation. Recent examples include the Harvard i-lab, experiments in teaching and learning such as FIELD, and HBX.
Philanthropic revenues, including distribution from the endowment and current use gifts, are equally important to the HBS economic model. Funds from alumni giving provide additional financial stability and flexibility that are crucial to the School’s ability to execute on its mission.
The revenues from these sources in any given year are sensitive to trends in the economy and the capital markets. These trends remained favorable for a sixth consecutive year in fiscal 2016. As a result, the School’s total revenues grew by $54 million, or 7.6 percent, from fiscal 2015.
MBA Tuition & Fees
Student tuition and fee revenues from the School’s flagship educational program grew to $127 million, from $120 million in fiscal 2015. First-year MBA tuition in fiscal 2016 was $61,225, compared with $58,875 last year. The School’s combined tuition and fees for fiscal 2016 were near the midpoint among the seven peer schools tracked by HBS.
Tuition and fee revenues do not fully recover MBA Program operating expenses at HBS, much less the School’s long-term investments in academic innovation. The shortfall is offset primarily with income from gifts given by alumni and friends of the School whose generosity enriches the HBS educational experience for future generations of students.
Harvard Business Publishing
The School’s publishing group leveraged new products and technologies to continue improving the customer experience and expanding its market reach in fiscal 2016. Despite the negative impact of the revenue recognition accounting transition for Harvard ManageMentor that began in fiscal 2015, HBP’s total revenue grew by $14 million, or nearly 7 percent year over year, to $217 million—doubling our forecasted growth rate.
This growth was primarily driven by the Corporate Learning group, where sales increased 16 percent from fiscal 2015 on strong demand for Harvard ManageMentor. Higher Education group sales grew 5 percent, largely as a result of broader global distribution of HBS cases. HBR group sales were unchanged from the prior year’s record high, reflecting continued strength in Harvard Business Review circulation and advertising revenue. International sales grew 4 percent, comprising 34 percent of HBP’s total annual revenues.
Executive Education
Completing the Chao Center in fiscal 2016 capped a multiyear effort to add vitally needed Executive Education living, classroom, dining, project, and gathering space in the northeast section of the campus. The Executive Education group continued to capitalize on this expanded capacity during the year. Revenue grew nearly 5 percent to $176 million, reflecting higher enrollment and tuition increases.
Total Executive Education Program enrollment increased 3 percent from fiscal 2015 to approximately 10,900. This growth reflected an additional offering of an existing program in the School’s comprehensive leadership program portfolio, as well as higher custom and global program participation. Enrollment in the School’s focused programs was lower than in fiscal 2015—a not atypical fluctuation in this part of the Executive Education portfolio.
Gifts & Endowment
Although income from HBP and Executive Education makes HBS less reliant on its endowment than other schools at Harvard, philanthropic revenues are crucial to the School’s economic model. In fiscal 2016, total revenue from three sources—endowment distribution as well as unrestricted and restricted current use gifts—increased to $210 million, or 28 percent of total revenues, from $190 million, or 27 percent of total revenues, in fiscal 2015. In contrast, for Harvard University as a whole, the corresponding amount for fiscal 2016 was 45 percent of total operating revenues.
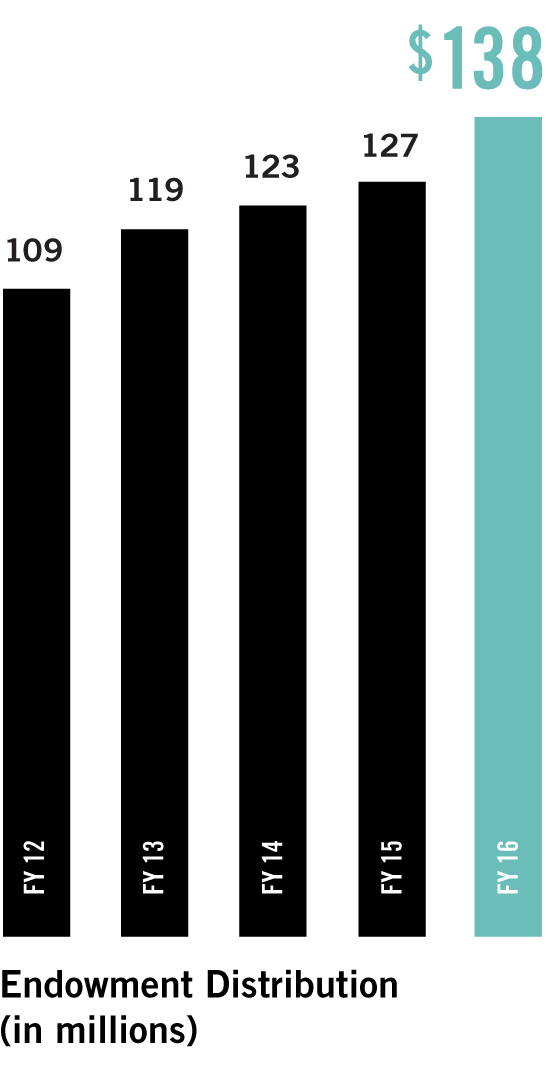
The largest of the School’s three philanthropic revenue sources is the annual endowment distribution. The endowment distribution for fiscal 2016 increased 9 percent from the prior year to $138 million, amounting to 18 percent of the School’s total revenue.
The HBS endowment currently consists of more than 1,000 discrete funds established over the years by individual donors, corporations, and reunion classes. The School budgets the use of endowment distributions to support operations in accordance with the donors’ intentions and the terms of each gift.
The University determines each year’s endowment payout rate—that is, the percentage of the endowment’s prior-year market value withdrawn and distributed for operations and for one-time or time-limited strategic purposes. This rate applies to HBS and the other schools at Harvard.
Consistent with the long-term goal of preserving the value of the endowment in real terms (after inflation) and generating a predictable stream of available income, the University’s targeted annual payout range is between 5.0 and 5.5 percent. The payout rate for fiscal 2016 was 5.1 percent, unchanged from the prior year.
Funds within the HBS endowment, along with those of the other Harvard schools, are managed by Harvard Management Company (HMC), a subsidiary governed and wholly owned by the University. HMC’s mission in managing the University endowment is to help ensure that Harvard has the financial resources to confidently maintain and expand its preeminence in teaching, learning, and research for future generations.
In executing on its investment mission, HMC is pursuing three key objectives that it believes are essential to delivering superior long-term risk-adjusted returns. These investment objectives, which measure HMC’s performance against real, relative, and peer returns, are ambitious goals set to serve the University over the long term.
Fiscal 2016 was a difficult investment year for all endowments and pensions, the worst since the 2008–09 financial crisis. The Harvard endowment generated a –2 percent investment return, net of all expenses and fees, compared with a +5.8 percent investment return for the prior year.
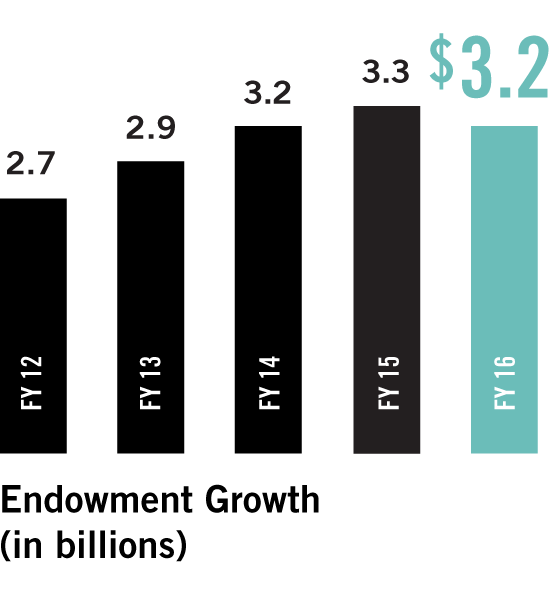
The fiscal 2016 year-end market value of the HBS endowment, plus the School’s current use gifts, was $3.2 billion at June 30, 2016, compared with $3.3 billion a year earlier. This decrease reflected the 2 percent net decline in market value and the subtraction of the School’s annual distribution and decapitalization, offset by the $51 million in endowment gifts received by HBS during the year.
HBS raises its own funds, as do other Harvard schools. Through The Harvard Business School Campaign, the HBS community continued to demonstrate extraordinary involvement and generosity, giving $161 million in new gifts and pledges to the School during the year. This compares with $166 million during fiscal 2015.
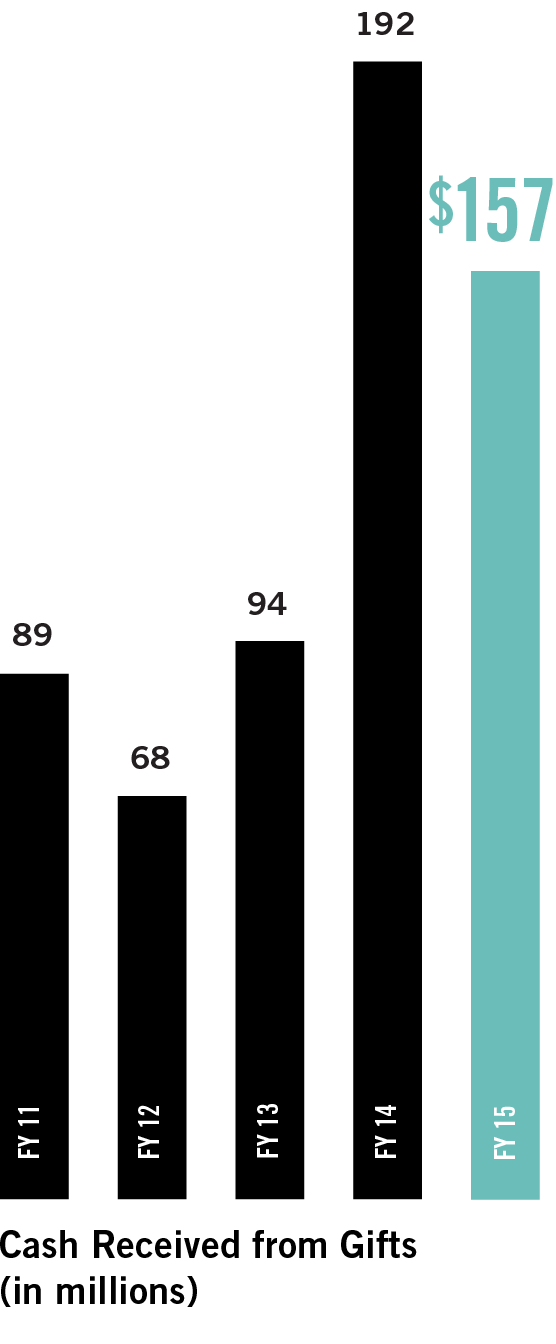
HBS received gifts from more than 12,800 donors in fiscal 2016, including MBA, Doctoral, and Executive Education Program alumni, as well as friends of the School. Approximately 27 percent of the School’s MBA alumni gave to HBS in fiscal 2016, unchanged from the prior year. Total cash received from gifts, including new endowment gifts and gifts for capital construction projects, payments on prior years’ pledges, and restricted and unrestricted current use giving, was $141 million, compared with $157 million in fiscal 2015.
Unrestricted current use giving to HBS grew in fiscal 2016 for the seventh consecutive year, providing critical funding for innovation across the School. Revenue from these flexible gifts was up 11 percent to $40 million, from $36 million in fiscal 2015. Revenue from restricted current use gifts increased more than 18 percent to $32 million, from $27 million a year earlier. Reflecting normal year-to-year variability in the timing of payments on pledges, cash giving to the endowment declined to $51 million, from $69 million in fiscal 2015, and cash giving for construction projects decreased to $16 million from $23 million.
Harvard Endowment Returns
| Harvard Endowment | |
|---|---|
| FY 16 | -2.0% |
| FY 15 | 5.8 |
| FY 14 | 15.4 |
| FY 13 | 11.3 |
| FY 12 | - 0.1 |
| FY 11 | 21.4 |
| FY 10 | 11.0 |
| FY 09 | - 27.3 |
| FY 08 | 8.6 |
| FY 07 | 23.0 |
| 5-Year Growth | 5.9 % |
| 10-Year Growth | 5.7 % |
HBX
While HBX is envisioned as an academic program that will develop over the long term, joining Executive Education and HBP as a significant contributor to the School’s earned revenue and income from operations, it remains in startup mode, and is expected to require continuing investment for the next several years. Although revenue at HBX doubled from fiscal 2015 to $10 million, higher expenses resulted in a $12 million operating deficit.
Housing, Rents, Interest Income, & Other
Revenue in the Housing, Rents, and Other category for fiscal 2016 was flat with the prior year at $21 million. Reflecting historically low interest rates, the School’s interest income also remained flat, year over year, at zero.
* In pursuit of greater comparability across the Harvard schools, the University has asked all the schools to report their net results in accordance with generally accepted accounting principles (GAAP) in the United States. In addition to results for fiscal 2016, the School’s results for fiscal years 2014 and 2015 are presented in accordance with GAAP within the Statement of Activity and Cash Flows.
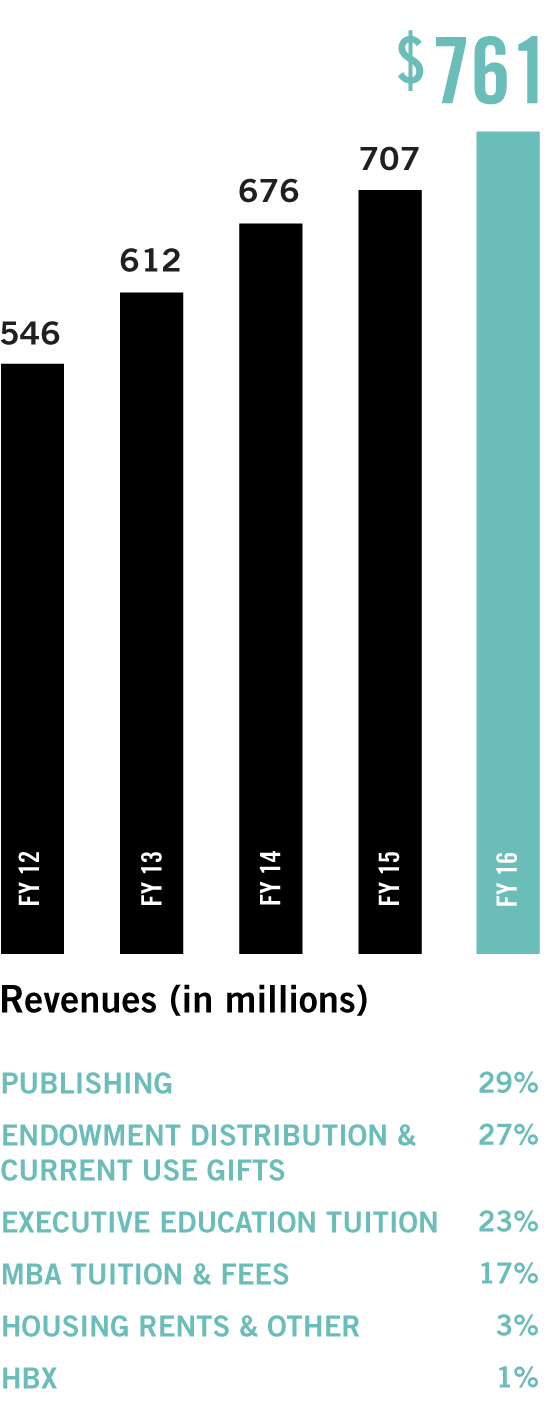
Revenues
Chart showing revenue of each fiscal year
- Fiscal Year 2012 546 million
- Fiscal Year 2013 612 million
- Fiscal Year 2014 676 million
- Fiscal Year 2015 707 million
- Fiscal Year 2016 761 million
- Publishing: 29%
- Endowment Distribution & current Use Gifts: 27%
- Executive Education Tuition 23%
- MBA Tuition & Fees: 17%
- Housing, Rents, & Other: 3%
- HBX: 1%
Cash Received from Gifts
Chart showing cash gifts of each fiscal year
- Fiscal Year 2012 68 million
- Fiscal Year 2013 94 million
- Fiscal Year 2014 192 million
- Fiscal Year 2015 157 million
- Fiscal Year 2016 141 million
Endowment Distribution
Chart showing endowment distibution of each fiscal year
- Fiscal Year 2012 109 million
- Fiscal Year 2013 119 million
- Fiscal Year 2014 123 million
- Fiscal Year 2015 127 million
- Fiscal Year 2016 138 million
Endowment Growth
Chart showing endowment growth of each fiscal year
- Fiscal Year 2012 2.7 billion
- Fiscal Year 2013 2.9 billion
- Fiscal Year 2014 3.2 billion
- Fiscal Year 2015 3.3 billion
- Fiscal Year 2016 3.2 billion
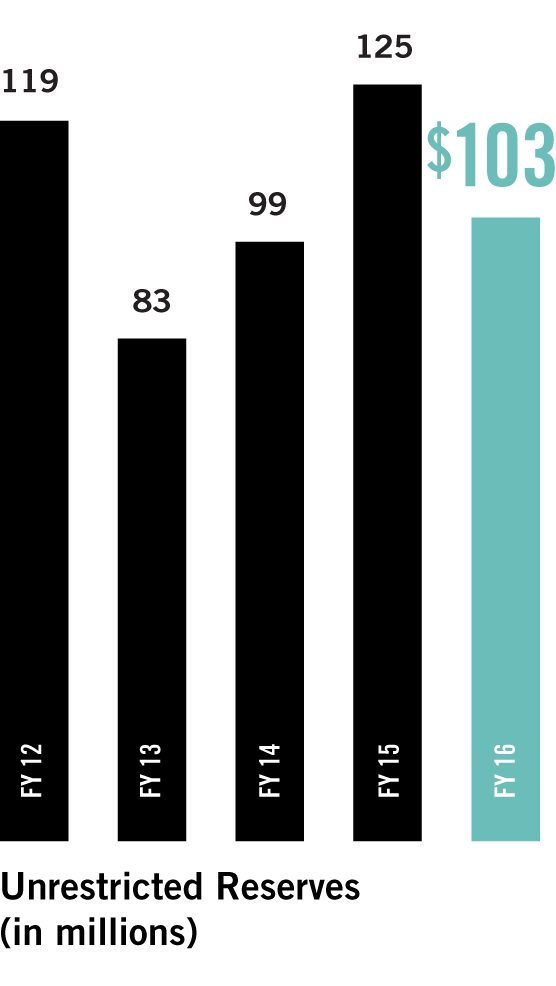
Unrestricted Reserves
Chart showing unrestricted reserves of each fiscal year
- Fiscal Year 2012 119 million
- Fiscal Year 2013 83 million
- Fiscal Year 2014 99 million
- Fiscal Year 2015 125 million
- Fiscal Year 2016 103 million
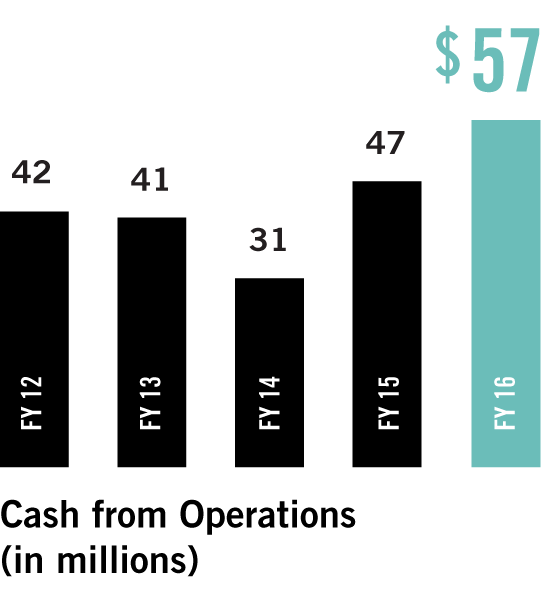
Cash from Operations
Chart showing cash from operations of each fiscal year
- Fiscal Year 2012 42 million
- Fiscal Year 2013 41 million
- Fiscal Year 2014 31 million
- Fiscal Year 2015 47 million
- Fiscal Year 2016 57 million