
Financials
Supplemental Financial Information
Expenses
The School’s total operating expenses for fiscal 2016 were $704 million, up by $44 million, or 6.7 percent, from the prior year. The principal drivers were upward pressure on compensation costs, as well as spending aimed at positioning HBP, HBX, and Executive Education for future growth. The increase was partially offset by a year-over-year decrease in space and occupancy expense.
Although HBS characterizes its publishing, digital learning, and executive program costs as operating expenses, they would in large part be considered as cost of goods sold in a profit-seeking enterprise. Expenses charged to HBP, HBX, and Executive Education include direct costs for staff compensation, specialized outside professional services in functional areas such as information technology (I.T.), and marketing and residence expenses for executive program participants.
HBP and Executive Education continued to deliver solid operating leverage on sales growth in fiscal 2016. As a result, despite incurring higher expenses and making significant growth-focused investments, each group provided important income contributions to the School’s operations for the year.
Faculty research expenses at HBS—nearly 19 percent of the operating budget—cut across several line items in the Statement of Activity and Cash Flows. The cost of faculty research includes a portion of faculty salary and benefits expense. It also includes direct costs for research support staff and travel, and for the School’s network of global research centers. In addition, HBS allocates a portion of the costs associated with library resources, campus facilities, technology, and administration to faculty research. The School’s total spending for faculty research support in fiscal 2016 rose by $8 million, or 6.5 percent, from the prior year to $131 million.
Salaries & Benefits
Employee compensation is the School’s largest expense, comprising nearly 44 percent of total operating costs in fiscal 2016. Salaries and benefits expense increased 5.1 percent in fiscal 2016 to $309 million, from $294 million in the prior year.
The total number of faculty at HBS, as measured in full-time equivalents (FTEs), can rise or fall in any given year as a result of retirements, departures, and fluctuations in recruiting activity. Net of retirements and departures, the School’s faculty increased by two FTEs to 233 in fiscal 2016, from 231 FTEs a year earlier. HBS also continued to expand its administrative staff, which grew to a budgeted 1,631 FTEs, from 1,541 in fiscal 2015.
In addition to supporting core academic programs and assisting in I.T. infrastructure development, the majority of the staff positions added in fiscal 2016 were focused on realizing income growth potential in HBP, HBX, and Executive Education. Staff positions also were added to support the Harvard i-lab and Global Initiative, as well as in External Relations to help sustain Campaign-driven giving to the School.
Fellowships
HBS categorizes fellowships, or financial aid, as an expense line item on the Statement of Activity and Cash Flows. Making education at HBS affordable to a broad cross section of applicants, regardless of their country of origin or their financial resources, is a longstanding goal of the School. The prospect of entering or returning to the workforce with high levels of education debt can deter strong MBA candidates from applying to HBS and can restrict their career choices upon graduation. This is particularly true for younger students, women, those from outside the United States, and students whose early career paths have not enabled them to reduce their undergraduate loans.
Consequently, the School strives to assist students in minimizing their debt at graduation by ensuring that fellowship support keeps pace with tuition and fees. Extending a long-term record of annual increases in financial aid, total fellowship expense for fiscal 2016, including assistance for doctoral candidates and a limited number of Executive Education participants, as well as for MBA students, increased by $3 million, or 6.8 percent, from fiscal 2015 to $47 million.
Approximately half of the School’s MBA students currently receive fellowships, which cover an average of more than 50 percent of a student’s total tuition. Average fellowship support per student increased 8 percent in fiscal 2016 to $35,571 from $32,919 in the prior year. Over the past five fiscal years, the School’s average two-year MBA fellowship award has grown from $53,563 for the Class of 2012 to $69,000 for the Class of 2017.
Funding for fellowships comes from restricted endowment and current use giving by HBS alumni and friends, supplemented by unrestricted funds as necessary—$3 million in 2016.
Publishing & Printing
Publishing and printing expense includes HBP’s production costs plus a small amount of spending related to the School’s printed materials and publications. HBP’s continuing growth in a fast-changing and highly competitive publishing environment reflects, in part, the success of the group’s long-term program of strategic investment in digital infrastructure and content. HBP continued to make growth-focused investments in fiscal 2016. The scale of its operations further expanded as revenues grew. As a result, the School’s total publishing and printing expenses for fiscal 2016 increased by $5 million from fiscal 2015 to $70 million.
Space & Occupancy
The HBS campus includes 36 buildings encompassing more than 1.8 million square feet of occupied space. Space and occupancy expense includes costs related to maintaining and operating the School’s buildings and campus infrastructure. In addition, facilities improvement and renovation costs that do not qualify as capital expenses are generally categorized as space and occupancy.
Also included under this category are expenses related to dining facilities and other campus services, and costs associated with leased space that houses operations at HBP and HBX, as well as the School’s global research offices. In addition, residence costs for executive program participants are reported as space and occupancy expenses.
The School’s space and occupancy expenses for fiscal 2016 were down by $6 million from the prior year to $62 million. Nearly $5 million of this decrease was caused by the recategorization of investments in new audio-visual, digital networking, and related I.T. systems as supplies and equipment expenses. The remaining $1 million primarily reflected the School’s underlying trend toward slower growth in building operating costs and utility bills, as a result of recent investments in facilities upgrades, renewal, and modernization.
Professional Services
Professional services expense for fiscal 2016 rose by $13 million from the prior year to $65 million. Increased spending for third-party I.T. support was a major driver. In addition to upgrading digital information capabilities related to core operations, HBS updated its student information system, began implementing a new learning management system in the MBA Program, and implemented a new technology platform to support a wide range of Executive Education functions. The increase in professional services expense also reflected costs that a for-profit business would categorize as cost of goods sold, including growth-driven spending in HBP and HBX, as well as the School’s decision to compensate faculty for teaching focused programs in Executive Education.
Supplies & Equipment and Other Expenses
Supplies and equipment expense rose by $7 million from the prior year to $14 million, primarily because of the aforementioned $5 million recategorization from space and occupancy. Spending in the other expenses category, which includes items such as travel and catering, increased by $2 million in fiscal 2016, to $73 million, reflecting planned expansion in these activities across the School.
Debt Service
HBS finances major capital projects with a mix of three sources of funding. The most important sources are gifts and unrestricted reserves of internally generated cash. The School also makes strategic use of debt financed through the University as a means of optimizing its capital structure.
Relying on the University as its banker provides HBS, as well as the other Harvard schools, with access to debt on a triple-A-rated tax-exempt basis. The School borrows only to finance qualified capital projects, carefully considering the interest rate environment, expectations for the performance of the Harvard endowment, and the availability of University debt.
Reflecting this cautious approach, the HBS balance sheet historically has been only modestly leveraged, and debt leverage remained low in fiscal 2016. The School’s total capital expenses increased to $113 million, from $81 million in the prior year. As in fiscal 2015, these investments were primarily funded by internally generated cash, and there were no new borrowings. HBS paid down $7 million in building debt in fiscal 2016, the same amount as in the prior year.
As a result, the School’s year-end fiscal 2016 building debt-to-asset ratio decreased to 1.7 percent, from 1.8 percent in the prior year. Other university debt—mainly consisting of repayment obligations to the University for mortgage loans made by HBS as a faculty recruiting incentive—decreased by $2 million from fiscal 2015 to $24 million.
The School’s debt service expense consists of interest payments to the University and is covered by using cash from operations. Fiscal 2016 debt service expense decreased by $1 million from the prior year to $4 million. As in fiscal 2015, this expense was mainly associated with borrowings to finance prior years’ campus expansion. Consistent with the two prior years, the interest portion of the School’s debt service amounted to less than 1 percent of total operating expenses in fiscal 2016.
University Assessments
University assessments cover essential services provided to HBS by the University, including payroll and benefits administration, processing of accounts receivable and payable, and legal services. The amount charged to HBS in any given year is primarily calculated as a percentage of the School’s total expenses. As expected, the School’s expense in fiscal 2016 for these assessments increased by $2 million from the prior year to $22 million.
Depreciation
The School computes depreciation using the straight-line method over the estimated useful lives of the assets. Depreciation expense for fiscal 2016 increased by $4 million, or 11.8 percent, from the prior year to $38 million. This increase primarily reflected the School’s larger asset base following the completion of renovation work at Esteves Hall and the opening of the Chao Center in the fourth quarters of fiscal 2015 and 2016, respectively.
Cash Before Capital Activities
The School’s cash from operations increased in fiscal 2016 by $10 million from the prior year to $57 million. As in fiscal 2015, this cash was largely generated by margin contributions from Executive Education and HBP, as well as generous giving to the School by alumni and friends. In addition, depreciation contributed $38 million to the School’s cash flow in fiscal 2016, compared with $34 million in the prior year.
Net Capital Expenses
The School’s total capital investment rose to $113 million in fiscal 2016, from $81 million a year earlier, primarily reflecting the completion of the Chao Center, renovation of new headquarters space for HBP, and the ongoing construction of Klarman Hall and the Pagliuca Harvard Life Lab. The School also stepped up its investments in facilities and I.T. upgrades, and renewal and maintenance projects across the campus, as well as energy efficiency measures to meet the University’s ambitious greenhouse gas reduction goals.
Net capital expenses more than doubled to $105 million, from $52 million for the prior year. In addition to the $32 million increase in capital investment, fiscal 2016 net capital expenses were higher because of an $18 million decrease in the use of gifts for capital projects. In addition, pre-funding of fiscal 2017 capital projects totaled $12 million, compared with $9 million of capital project pre-funding in the prior year. This item is described in the accompanying Statement of Activity and Cash Flows as Change in Capital Project Pre-Funding.
Changes in Debt & Other
The School’s debt and other expenses de- creased by $12 million in fiscal 2016, compared with a decrease of $3 million in fiscal 2015.
Because gifts, internally generated cash, and unrestricted reserves have been available and sufficient to finance capital activities, fiscal 2016 marked the School’s eighth consecutive year with no new borrowings. Debt principal payments were flat, year over year, at $7 million.
Capitalization of endowment income—or cash used to purchase endowment units—was a $3 million use of cash in fiscal 2016, the same as in the prior year. In compliance with federal and state legal requirements, the School’s objective is to spend as much of the endowment distribution as possible in any given year, according to the terms of each gift. Funds unspent as a result of gift restrictions are generally reinvested in the endowment.
In compliance with the law, HBS accesses the investment appreciation within existing endowment accounts when the terms of the gift require funds to be withdrawn at a rate higher than the University’s payout rate in any given year. Decapitalization of endowment income—or cash drawn from endowment appreciation—was a $5 million source of cash in fiscal 2016, unchanged from the prior year.
Other non-reserve activity in fiscal 2016 was –$7 million, compared with +$2 million in the prior year.
Ending Balance, Unrestricted Reserves
Together with a mix of internally generated cash, gifts, and debt, HBS relies on unrestricted reserves to finance major campus expansion projects and capitalize on unforeseen strategic opportunities. More than 50 percent of the School’s revenues come from Executive Education and HBP—business units that are highly sensitive to the economy.
Consequently, maintaining an ample balance of unrestricted reserves outside of the endowment is crucial in providing HBS with sufficient liquidity to fulfill its educational and research mission on a long-term basis. Driven by the School’s continued healthy cash from operations, fiscal 2016 was a successful year in this regard. HBS sustained its operations, executed on mission-driven initiatives, and increased its investment in the campus, while still concluding the year with a strong unrestricted reserves balance of $103 million.
* In pursuit of greater comparability across the Harvard schools, the University has asked all the schools to report their net results in accordance with generally accepted accounting principles (GAAP) in the United States. In addition to results for fiscal 2016, the School’s results for fiscal years 2014 and 2015 are presented in accordance with GAAP within the Statement of Activity and Cash Flows.
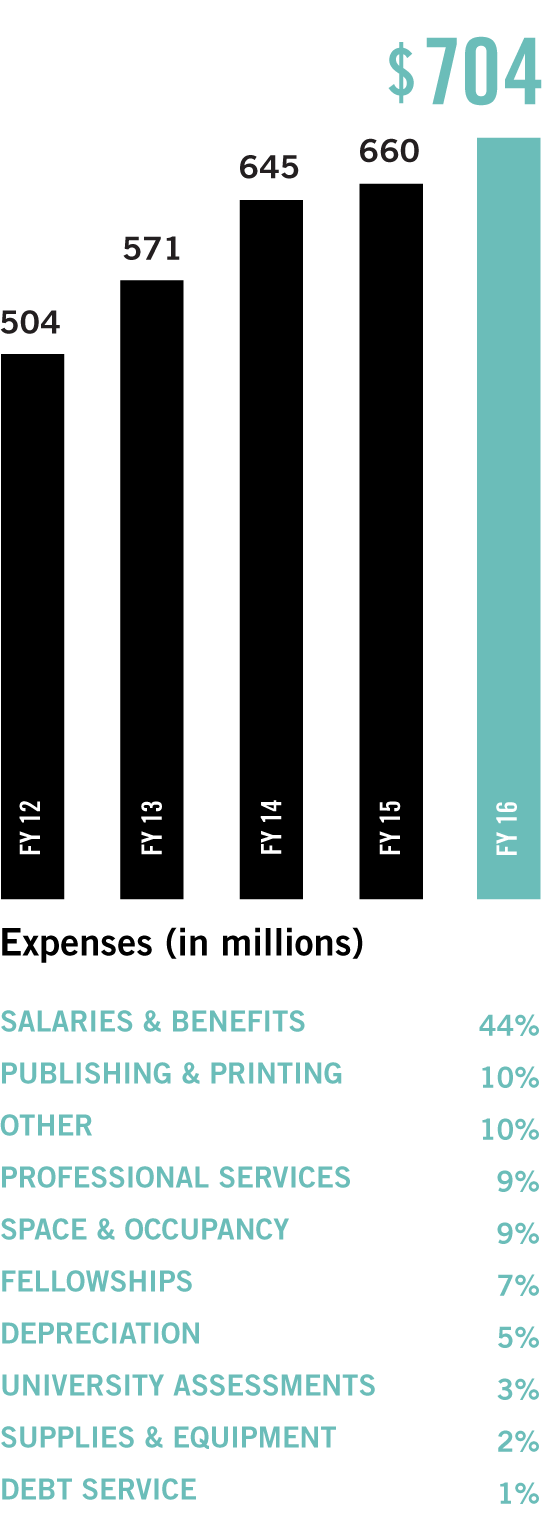
Expenses
Chart showing expenses of each fiscal year
- Fiscal Year 2012 504 million
- Fiscal Year 2013 571 million
- Fiscal Year 2014 645 million
- Fiscal Year 2015 660 million
- Fiscal Year 2016 704 million
- Salaries and Benefits: 44%
- Publishing and Printing: 10%
- Other: 10%
- Professional Services: 9%
- Space and occupancy: 9%
- Fellowships: 7%
- Depreciation: 5%
- University Assessments: 3%
- Supplies and Equipment: 2%
- Debt Service: 1%