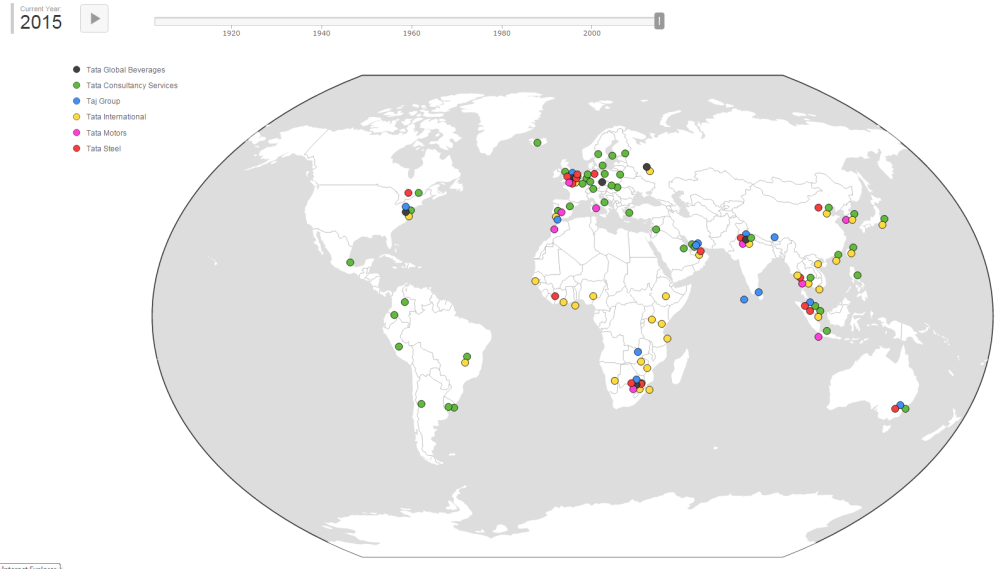
The HBS Historical Data Visualization (HDV) tool charts the global growth and evolution of business over time and includes historical mapping of major economic and political indicators. It includes maps of the global expansion of firms based in emerging markets.

This mapping tool developed by global strategy professor Pankaj Ghemawat features extensive historical data on more than 500 countries. Animated maps present historical trends and projections of future developments. Users can search by country, industry, map type, and theme.

Worldmapper offers a range of map generated by various metrics and topics, including manufactures, services, transport, resources, and education. A PDF is available for each map which provides a list of countries and a brief contextual explanation.

Princeton University’s Mapping Globalization project provides three different types of cartographic resources. Historical maps show how human understandings of space have changed
over time. Narrative maps show changes over time, for example, in the movement of goods between countries. Lastly, data analysis and visualization explore trade networks from both micro- and macroeconomic perspectives.

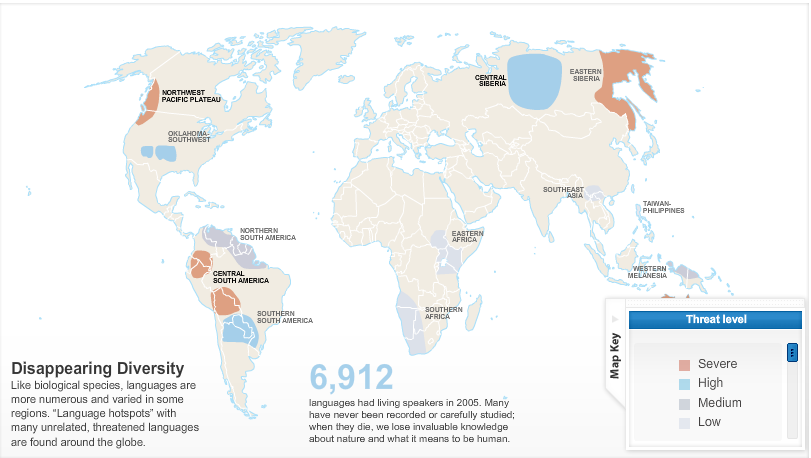
A visual guide to global trends, National Geographic’s EarthPulse has maps and detailed charts showing the effects of globalization on technology, population, quality of life, food and water, and more.

Harvard College Library’s Digital Maps Collection offers a number of historical maps available for instant viewing.
